

Lower export unit values and Brazil's removal of the duty on extra virgin explain much of the latest increase in imports, but they do not explain Portugal's 62% share, which was built through brands, packaged distribution and decades of market development.
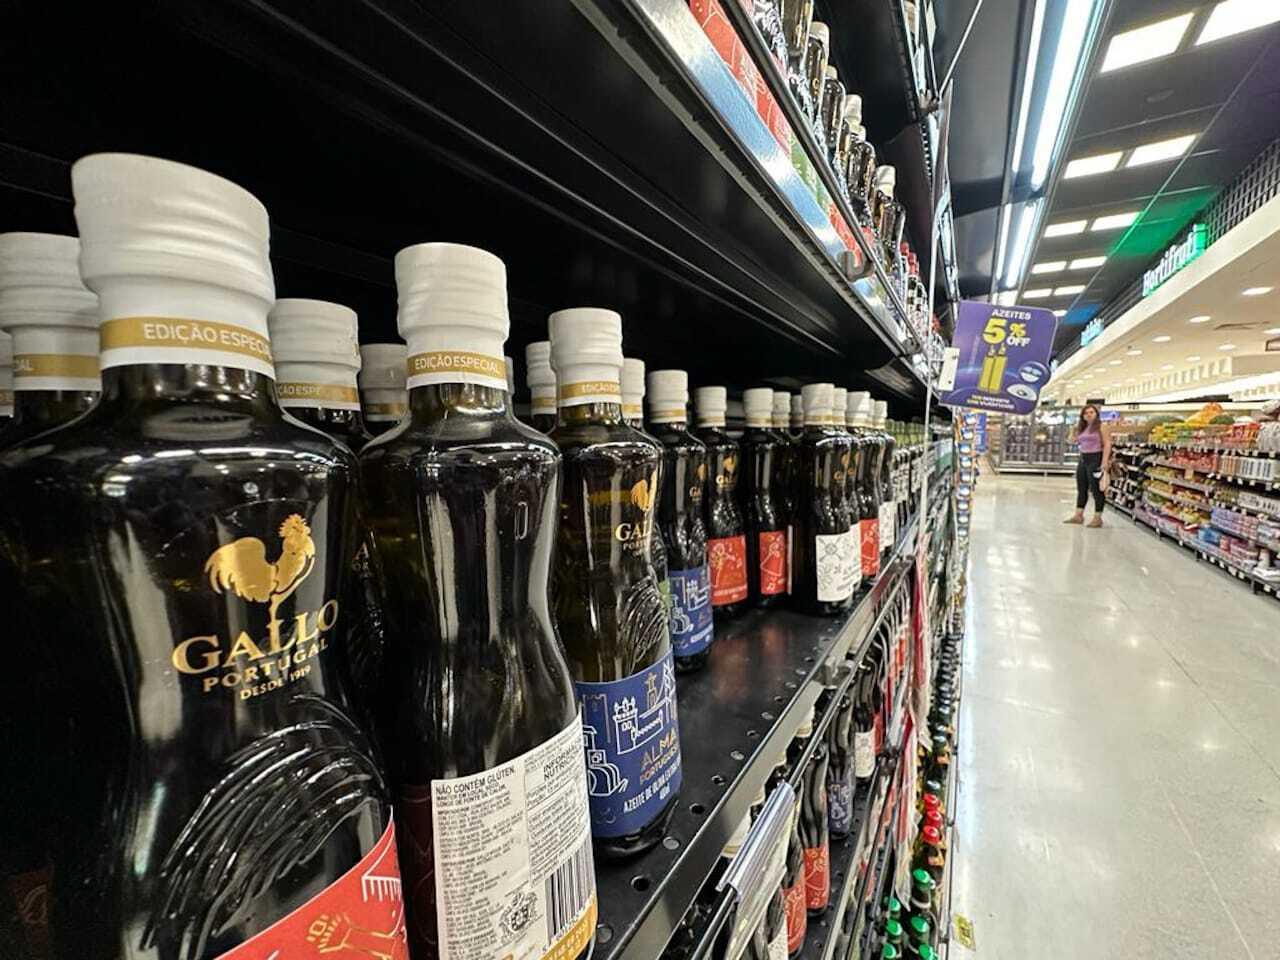
Brazil's formal application to join the International Olive Council arrived at a convenient moment for anyone inclined to tell a growth story. On 9 September, Brazil's ambassador to Spain delivered the request to the IOC's executive director, Jaime Lillo, while provisional IOC figures supplied a ready-made narrative: the country imported 80,768 tonnes of olive oil in the 2024/25 crop year, purchases increased from 31,580 to 44,365 tonnes in the first six months of 2025/26, and Portugal supplied 62% of the previous campaign's total, increasing its sales by 20.3% even as Brazil's overall imports declined slightly.
Those figures establish the size of the market and the strength of the latest rebound, but they do not establish that Brazilian consumption has entered a new structural phase because two different mechanisms are at work. Lower prices and a tariff change provide the strongest explanation for the return of volume after two exceptionally expensive years, whereas Portugal entered that rebound from a dominant position built through brands, distribution and commercial infrastructure rather than recreated in the bulk market each season. Brazil does have long-term potential, since its imports have risen from approximately 50,000 to 80,000 tonnes over the past decade and IOC estimates for 2022/23 put consumption at only 0.4 kg per person, compared with 3.7 kg in Portugal; yet that gap, while showing considerable room for expansion, does not explain why imports rose by 40.5% within six months.
The rebound followed the price down
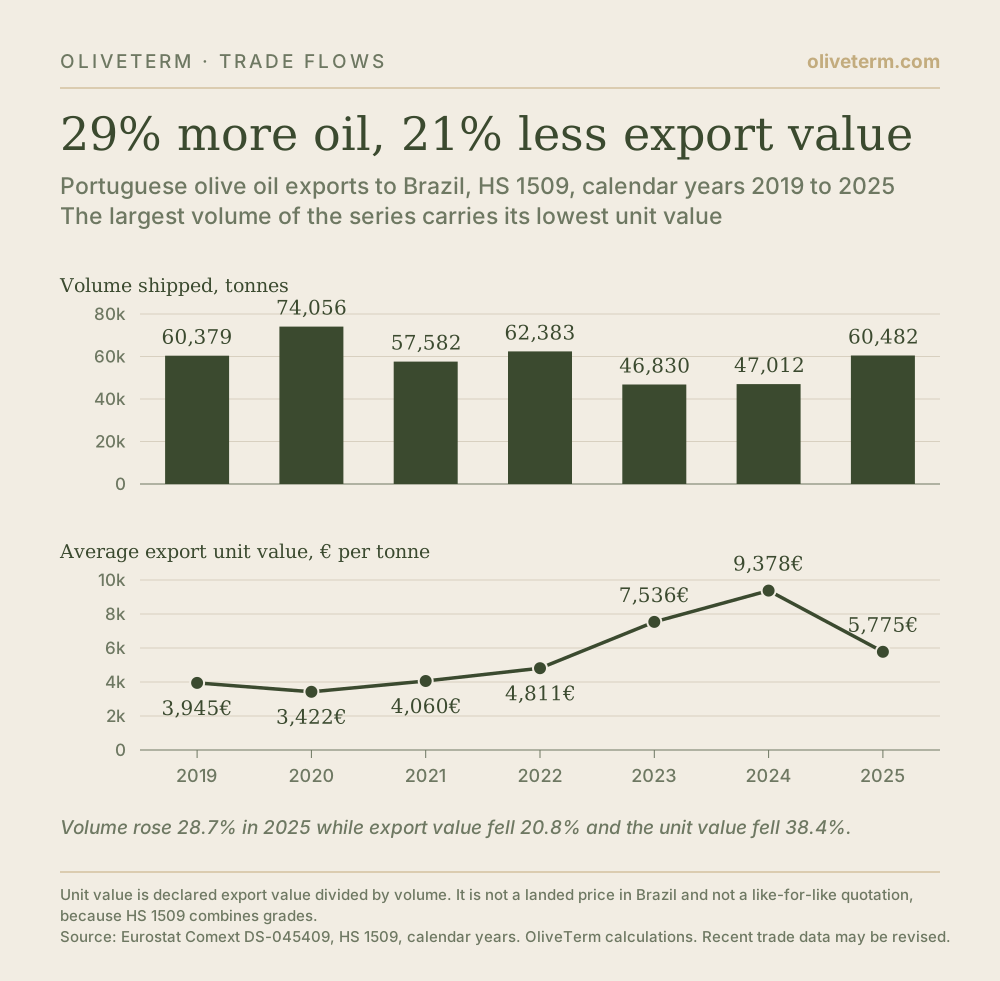
Eurostat's bilateral trade series records both the volume and declared value of Portuguese exports to Brazil, allowing an average export unit value to be calculated by dividing one by the other. This is neither the final landed price paid by a Brazilian importer, since it excludes the subsequent effects of freight, insurance, import duties, exchange rates and domestic taxes, nor a like-for-like quotation for a constant product, because HS 1509 combines different olive oil grades and the composition of shipments can change; even so, the reversal in 2025 remains difficult to miss.
Portugal exported 60,482 tonnes of olive oil to Brazil in calendar 2025 with a declared value of 349.3M€, compared with 47,012 tonnes worth 440.9M€ in 2024, which means that volume increased by 28.7% even as export value fell by 20.8% and the average unit value dropped by 38.4%, from 9,378€ to 5,775€ per tonne.
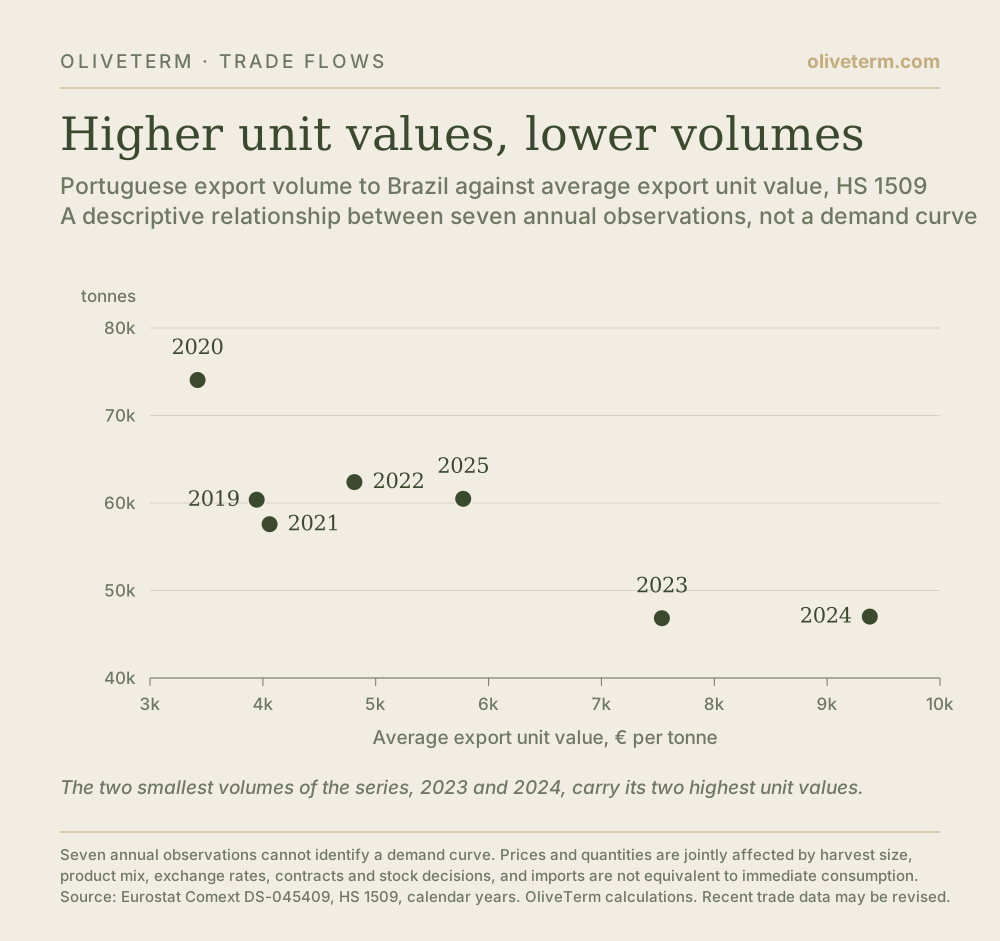
The preceding rise shows the same relationship in reverse, since between 2020 and 2024 the average unit value increased from 3,422€ to 9,378€ per tonne while volume fell from 74,056 to 47,012 tonnes; across the full seven-year series, the largest volume therefore coincides with the lowest unit value, while the two smallest volumes coincide with the two highest.
Seven annual observations cannot identify a demand curve, since prices and quantities are jointly affected by harvest size, product mix, exchange rates, contracts and inventory decisions, while imports themselves are not equivalent to immediate consumption because distributors may rebuild stocks when replacement costs fall after running them down during expensive years. The series nevertheless shows a strong inverse relationship between export unit values and the quantities purchased from Portugal, making the latest increase more consistent with a price-sensitive market returning to an established range than with Brazilian preferences changing suddenly in late 2025.
The IOC crop-year figures and Eurostat's calendar-year series should not be expected to match exactly for similar reasons: Portugal's 62% share of 80,768 tonnes implies about 50,000 tonnes during the 2024/25 campaign, whereas Eurostat records 60,482 tonnes during calendar 2025, which also includes the first three months of the 2025/26 campaign. Different time windows therefore explain part of the gap, while reporting direction, product coverage and later revisions may account for the rest.
A tariff cut reinforced the move
The second price effect arrived in the same window, as Brazil announced a package of food-tariff reductions on 6 March 2025 that took effect eight days later and lowered the import duty on extra-virgin olive oil, NCM 1509.20.00, from 9% to zero. The scope matters because the measure applied specifically to extra virgin rather than every product contained in HS 1509, although the affected category sits within the dominant virgin-oil segment, which accounted for 85% of Brazilian imports in 2024/25.
The comparison behind the IOC's 40.5% increase consequently spans two tariff regimes: extra-virgin shipments entering between October 2024 and mid-March 2025 generally faced a 9% duty, whereas the entire October 2025 to March 2026 period fell under the zero rate, which the government presented as temporary without attaching a fixed expiry date.
Although the trade series cannot separate the tariff effect cleanly from the fall in export unit values, or show how much of the saving reached consumers rather than being absorbed elsewhere in the chain, it does establish that a large part of the market became cheaper to import just as origin prices were retreating. Together, those changes provide a compelling explanation for much of the rebound without requiring a sudden shift in Brazilian appetite, while the earlier contraction under record unit values explains why the additional 12,785 tonnes imported during the first half of 2025/26 cannot yet be treated as permanent: a recovery in imports is not the same as a structural acceleration in consumption.
Portugal's 62% is a different story
If lower prices explain why Brazil bought more oil, they do not explain why Portugal supplied almost two-thirds of it, particularly when Spanish production sets much of the international market's availability and price direction. In a purely transactional Brazilian market, the largest and cheapest origins would have more scope to displace Portugal whenever the crop changed, yet the Portuguese lead predates the latest cycle: figures reported by RTP in 2012 placed Portuguese suppliers at 55% of Brazilian import volume and 58% of value, compared with 26% of volume for Spain and 12% for Argentina. Although the historical series is not directly comparable with the IOC's current campaign data, it shows that Portugal held a majority position well before the drought, price spike and subsequent correction of the past three years.
The commercial roots run deeper, with Gallo's corporate history identifying Brazil as one of its first foreign markets in 1938, chosen partly because of the large Portuguese community. The brand says Nielsen data showed it becoming Brazil's market leader in 2004, after which it launched its first advertising campaign created specifically for Brazilian consumers in 2006, so language and diaspora reduced the original cost of entry while continued investment turned that familiarity into mass-market distribution.
Andorinha demonstrates that the advantage is structural without being static, because the Sovena-owned brand moved from about 2% of Brazil's extra-virgin segment in 2006 to almost 30% by 2026, according to figures reported by Exame, after Sovena took direct control of its Brazilian distribution in 2016 and brought retailer relationships and market execution inside the company. The leading brand could therefore change even as the wider Portuguese supplier position endured.
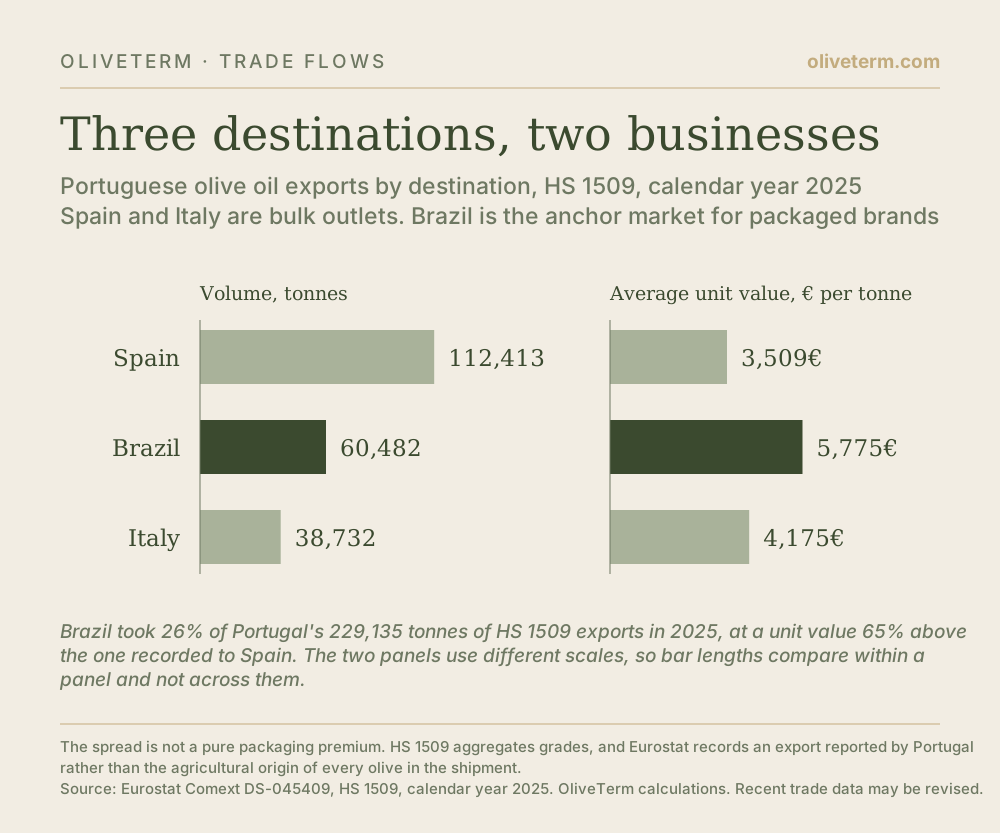
Eurostat's 2025 destination data are consistent with this division between commercial models, with Portugal exporting 112,413 tonnes to Spain at an average unit value of 3,509€ per tonne, 38,732 tonnes to Italy at 4,175€ and 60,482 tonnes to Brazil at 5,775€, making the recorded unit value to Brazil 65% higher than to Spain.
That spread is not a pure packaging premium, since HS 1509 aggregates grades and the average can move with product composition, while Eurostat records an export reported by Portugal rather than the agricultural origin of every olive in the shipment. The figures nevertheless fit the underlying structure in which Spain and Italy are major industrial outlets for Portuguese bulk oil, whereas Brazil is the anchor market for Portuguese brands and packaged exports, accounting in 2025 for 26% of Portugal's total HS 1509 export volume of 229,135 tonnes.
Portugal's 62% should therefore not be described simply as a Brazilian preference for Portuguese origin, because supplier country, agricultural origin and brand ownership are different things, while the durable advantage lies in the route to market through established brands, local distribution, retailer confidence, familiar packaging and decades of consumer recognition. A cheaper bulk offer may compete for the oil inside the bottle without automatically taking the bottle's place on the shelf.
Membership gives Brazil a seat, not a demand shock
Joining the IOC would give Brazil a voice inside the organisation responsible for international olive oil definitions, testing methods and authenticity work, thereby creating a stronger framework for technical cooperation and possible regulatory alignment without automatically rewriting Brazilian labelling rules or enforcement, which remain matters for national authorities.
The implications are nevertheless commercial because Brazil relies overwhelmingly on imports while supporting a domestic industry that, although small in volume, is increasingly visible in premium extra virgin; clearer standards and stronger authenticity controls would consequently matter both to local producers and to suppliers of packaged imported oil, with Portugal having the largest installed position to protect.
Brazil's application is therefore significant not because it proves that consumption is about to accelerate, but because it recognises that the country is already one of the world's important import markets, whose next purchases will depend on the cost of oil in Brazilian reais, the duration of the zero tariff on extra virgin, inventory levels and the next movement in Spanish and Portuguese origin prices. At around 80,000 tonnes a year, Brazil is not waiting to become a market, and while the latest rebound shows how quickly its importers return when costs fall, Portugal's share demonstrates something more durable: market leadership is built on the shelf rather than rediscovered at the lowest offer each campaign.
Sources
- International Olive Council: Olive sector statistics, June/July 2026 (Brazil imports in 2024/25, the first half of 2025/26, Portugal's 62% share and the virgin-oil segment)
- International Olive Council: Brazil seeks to join the International Olive Council (the membership request of 9 September)
- International Olive Council: Olive sector statistics, March 2025 (per-capita consumption estimates for 2022/23)
- Eurostat: Comext international trade in goods database (HS 1509 volumes and declared values behind every unit value in this article)
- Brazilian federal government: Governo federal confirma tarifa zero para alimentos (the March 2025 food-tariff package and the zero duty on NCM 1509.20.00)
- RTP: Acordo sobre importação de azeite português (Portuguese, Spanish and Argentine shares of Brazilian imports in 2012)
- Gallo: Our history (entry into Brazil in 1938, Nielsen market leadership in 2004 and the 2006 campaign)
- Vida Rural: Sovena assume a sua própria distribuição no Brasil (Sovena taking direct control of Brazilian distribution in 2016)
- Exame: Como a Andorinha virou líder do azeite extra virgem no Brasil (Andorinha's move from about 2% to almost 30% of the extra-virgin segment)
Eurostat figures are OliveTerm calculations based on HS 1509, calendar years 2019 to 2025. Recent trade data may be revised.